Chapter 5: Diagnosis from medical images
By Zhe Liu and Martin R. Prince, MD, PhD
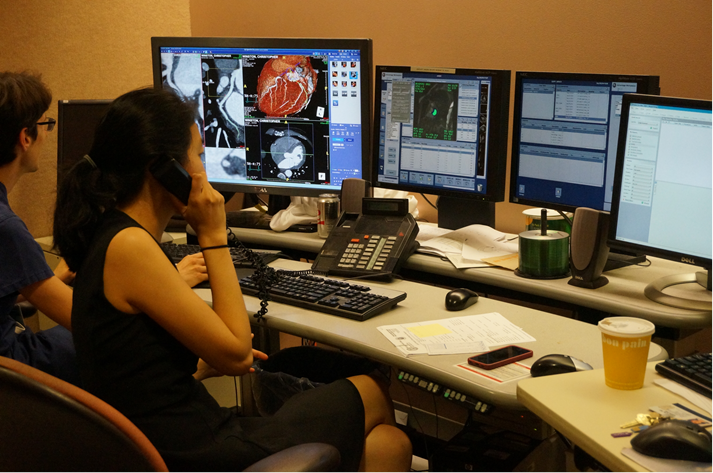
Once generated by one of the several imaging machines, medical images must be read and interpreted by trained professionals. The correct interpretation of medical images is vital to the execution of effective diagnostic and therapeutic decisions. Reading and interpreting medical images well is a skill that takes many years of training. However, one does not need to be a radiologist to understand the three basic steps of reading medical images: determine the imaging method, understand the scanned anatomy, and locate the abnormal anatomy.
5.1 Determining the imaging methodVarious imaging modalities may be used to scan a patient, including x-ray, CT, MRI and ultrasound (US). The first task a radiologist or other health care professional must do when reading an image is to determine the specific method that was used to acquire the image. Though an experienced radiologist can identify the method used to obtain an image without hesitation, this is not a natural skill, but rather one that must be learned and honed through training. Various visual aspects of the imaging methods set them apart from one another. While it is fairly easy to differentiate x-ray, CT and US, the various scanning methods within a modality require expertise to tell apart, particularly so for MRI, which has multiple commonly used contrasts. X-ray radiograph typically displays bone and joint structure as hyper-intense relative to soft tissues. CT scan of the head can visualize calcification and hemorrhage. CT scan of the lung is discernable for the hypointensity of air cavities and hyperintensity of string-like lung vessels and nodular cancerous lesions. MRI has very rich tissue contrasts, as exemplified in the brain case: T1-weighted images show gray matter dark and white matter bright; T2-weighted images show gray matter bright and white matter dark; T2* weighted images show hemorrhage dark; diffusion weighted images show dying cells in acute ischemia as bright. Ultrasound scans are shown in sequential timeframes, with relatively low spatial resolution but superior temporal resolution.
After determining the imaging method, the radiologist must determine what information is expected to be extracted from the image. It is common that X-ray provides skeletal information about bones and joints, and is widely used in examination of chest, hand and limb. CT scans of the lungs reveal information about both acute and chronic changes in the interior of lungs and are always applied to locate lung nodules. MRI, with its ability of various contrast schemes for soft tissues, is widely used for detection and characterization of pathologic lesions in the brain, heart, liver, pancreas and kidneys. Understanding the common principles of basic imaging techniques not only enables us to understand and identify the image method used, but also leads us to deduce the relevant information held in the image.
5.2 Understand the scanned anatomy
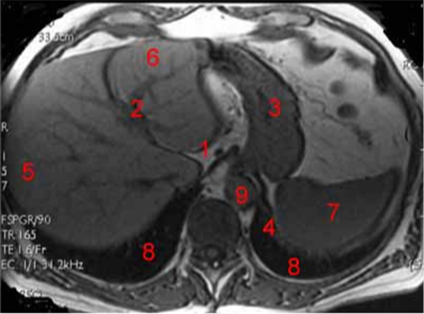
It is essential to understand the anatomical region that is being scanned, i.e., whether it is the head, chest (lung, cardiac), abdominal (liver, spleen, kidney), pelvis (uterus), or a general torso or limb scan. Although with some imaging modalities determining the anatomical context is easy to do, discerning each organ or tissue within the context of the image may be difficult for an inexperienced viewer. One example that illustrates this is an abdominal MRI scan. For this type of scan (Figure 2), it is impossible to make any diagnostic conclusions without a solid understanding of the different regions of the image and to what they correspond.
5.3 Locate the abnormal anatomy
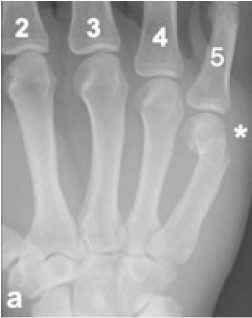
Locating abnormalities of the anatomy is not only the most important step for determining a diagnosis and potential treatment of a pathology, it is also the most difficult step, requiring years of training before it can be completed proficiently. To diagnose pathology from an image, one must have a thorough understanding of both human anatomy and biochemistry. Additionally, accurate diagnosis requires critical thinking and scientific reasoning, as the radiologist must determine the origin of pathology while provided limited information. The following example is given using an X-ray image of the hand.
In the case of Fig.3, the fifth metacarpal bone is fractured in the transverse direction, while the other metacarpal bones are intact. This fracture is located near the neck of the proximal end of this metacarpal. This type of fracture, which is close to the knuckle, could probably come from the compression of the knuckle against a hard surface, such as a wall or a skull. From the information in the radiograph, it is reasonable to postulate that the patient may have punched his clenched fist against some sort of hard object, which happens frequently among athletes in sports like boxing and martial arts. In fact, this injury is known as "Boxer's fracture".
5.3 Examples on how medical imaging helps in diagnosis and treatment planning
Although I had an understanding of how critical medical imaging was to making accurate diagnosis and planning effective treatment, I was still amazed and inspired when observing several real clinical cases, in which radiologists utilized medical images to measure tissue properties, locate pathological sites, guide the therapeutic planning, and examine the quality of treatment.
Case 1: MR Images in Liver Fat Quantification.
MR images are normally obtained by exciting tissue in the strong external magnetic field with RF waves, followed by a Fourier spatial encoding scheme and decoding reconstruction. The magnetic moment for tissue is subject to a precession movement in the presence of an external magnetic field (rotation in the transverse plane). Different tissues, such as water and fat, differ in their intrinsic magnetic properties and their magnetic moments (or so-called spins) and therefore rotate with different speed. The signals from different spins are not captured discretely, but rather as a sum. Therefore, at different times the signal may be strong (hyperintense) when the spins of water and fat point to the same direction (called "in-phase" image) or weak (hypointense) when the spins of water and fat have opposite directions (called "out-phase" image, Fig.5.4).
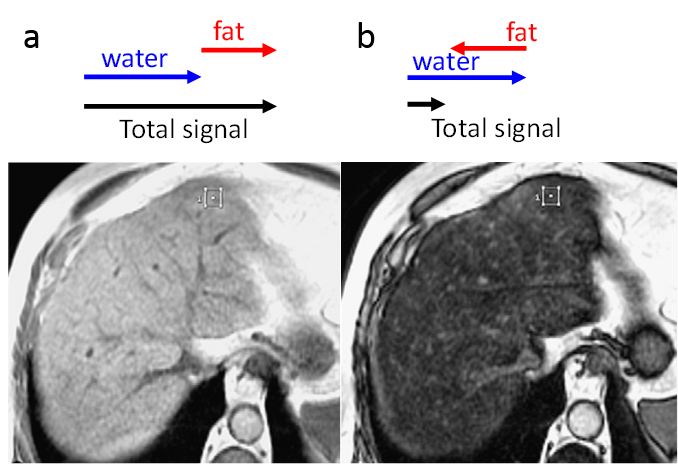
With simple algebra, it is possible to obtain the ratio of signal magnitude between water and fat from the pixel intensities in in-phase and out-phase images. Given that the signal for each voxel, which is also proportional to the intensity of the image, is the sum of all spin signals from that voxel, the signal magnitude ratio could reflect the fat percentage in each voxel in the scanned region, e.g. the liver. However, this process is complicated by the fact that spin signals decay in magnitude across different acquisition time points. This problem is usually resolved by comparing the signal reflecting both water and fat to signals from regions with relatively little fat. For example, in an abdominal MR scan, the radiologist typically divides the liver intensity by the spleen intensity in both the in-phase and the out-phase images. This approach is warranted by the fact that the fat content of the spleen is far lower than the fat content of the liver, so the division of the liver intensity by the spleen intensity could be used to compensate for the temporal decay. The following figure shows how radiologists manage to quantify fat content in the liver using in-phase and out-phase abdominal scans.
For each in-phase and out-phase image, radiologists choose regions of interest in the liver and spleen, calculate the intensity average in each region, and divide the mean liver signal intensity by the mean spleen signal intensity. Suppose the ratio is Rin for in-phase image, and Rout for out-phase image. The liver fat percentage is calculated as (Rin-Rout)/(2Rin)*100%.
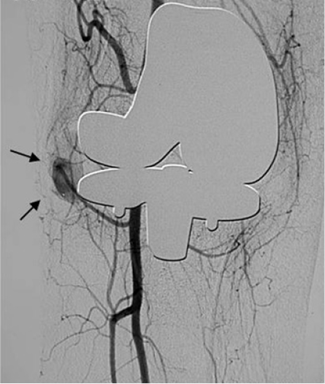
Case 2: Digital subtraction angiography in knee replacement
Traditional angiography is achieved by injecting an X-ray opaque contrast agent into the patient's blood vessel and then using X-ray imaging. The contrast enhanced X-ray image shows the contrast of the blood vessels against the background, but other structures such as bones and joints are also discernable. In order to get rid of the structures besides the blood vessels, Digital Subtraction Angiography is employed by subtracting the contrast enhanced image by a "mask image", which is taken at the same region before the injection of the contrast agent. The resultant image displays the blood vessels and their surrounding gray background with superior contrast. This technique is often used to examine blood vessels in knee replacement treatment, in which the post-operative growth of blood vessels around the implant site is critical for replacement success (Fig.5.5).
During my hospital experience, I witnessed a knee replacement case in which the patient was given a knee replacement made of metal and plastic that led to his return to the hospital due to severe swelling around the implant. The area around the implant was mostly filled with blood and the preliminary diagnosis was hyper-vascularity. In order to remove the over-growing blood vessels, physicians needed to know the exact location of the vessels. This information was obtained using Digital Subtraction Angiography, in which the doctor injected iodine contrast into the artery at the root of the thigh (where the artery is close to the skin), and took knee X-ray images at the rate of 10 per sec. Because the contrast in the blood vessels is opaque on X-ray, subsequent images are subtracted for better vascular visualization. Using this technique, the doctor could easily discern the location of the over-grown vascularity and effectively treat the pathology.