Chapter 4: Medical imaging techiques
By Yi Wang, PhD
Medical Imaging has become an integral part of all facets of medicine, including radiological diagnosis, imaging guided intervention, and pathology. According to a recent poll about the most significant recent medical innovations, three of the top five medical innovations in the past 50 years are in imaging based diagnosis (MRI and CT Scanning and mammography) or imaging guided therapy (balloon angioplasty). Imaging is used to visualize tumors, guide surgical procedures, and identify pathologies; Imaging has been and will continue to be an essential component in the healthcare of many patients.
There are many imaging devices used in various ways in patient care. This chapter tries to explain the basic concepts of major imaging techniques currently used in hospitals. Fundamentally, medical imaging requires an energy to penetrate into the body to obtain information about tissue. A tissue sample may be obtained using a knife or a drill, which is called biopsy, and then be analyzed with various biochemical staining, which is called histology or pathology. In the following, we should focus on noninvasive methods using electromagnetic waves (x-ray at very high frequency, and magnetic resonance at radiofrequency), as well as ultrasound, that can penetrate the body with no or little harm.
4.1 X-ray imaging - projection radiographyDiscovery of x-ray - one man's noise another man's signal. A partial-vacuum electrical discharge tube called a Crookes tube (named after one of its inventors William Crookes), which generates green fluorescence, had become widely available for physics research and entertainment after the 1870's. At that time, it was not known how the Crookes tube worked. Scientific investigations on the Crookes tube lead to two great discoveries in modern physics: the x-ray in 1895 by Wilhelm Roentgen and the electron in 1897 by JJ Thomson. With the development of quantum physics in the early part of the 20th century, we learned about the workings of the Crookes tube and x-ray generation. With a high voltage (>5kV) discharge, electrons are accelerated in the strong electric field to very high speed. As high-speed electrons pass near nuclei (bremsstrahlung) or knock out inner electrons (excited-ground state transition) in atoms in the anode, the glass tube, and air in the tube, x-rays are generated. X-rays had always been there in the Crookes tube. Indeed, early investigators including Ivan Puluj and Philipp von Lenard had noticed foggy marks on photographic plates nearby the Crookes tube in their experiments.
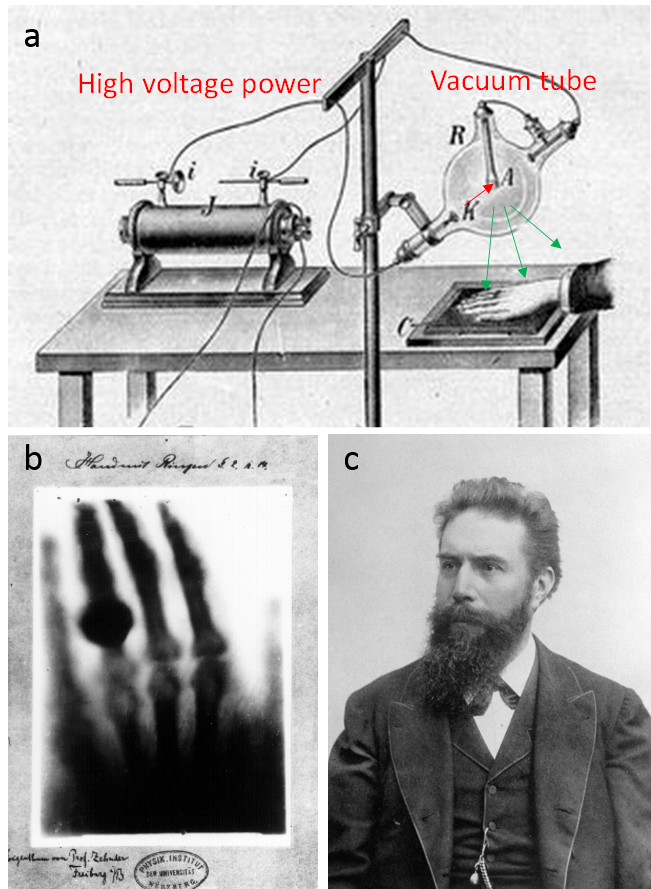
On Friday November 8, 1895, Roentgen observed the same faint mark on the detector photo plate when the Crookes tube was covered with a black cardboard. He wanted to make sure the "faint marks" were there not as noise or error but as signal - an exciting new ray (x as the standard notation for unknown in mathematics, hence x-ray). In the following weekend, Roentgen ate and slept in his lab (perhaps also to compete with Philipp von Lenard and others who had the same equipment) to repeat the experiments many times, replacing the cardboard with different materials. He found different materials had different abilities to attenuate x-ray. The attenuation increased with material thickness, and lead had the strongest attenuation. In the two weeks following his discovery, he made the first x-ray picture from the hand of his wife (Fig.4.1c), Anna Bertha, which clearly showed her underlying bone structure and her ring. This is the first ever image revealing internal structures of the human body without cutting it open, revolutionizing medicine.
Though x-ray technology has been advanced and standardized to a point where it is used consistently to diagnose and treat patients in modern medicine, it still relies on the same basic principles displayed by Willhelm Rontgen in 1895. X-rays are produced using an X-ray generator, travel through the body part of interest while being attenuated by tissue, and then are detected traditionally by photographic film, and in current digital radiography, by storage-phosphor image plate type digital detector. An X-ray tube consists of a vacuum tube with a cathode and an anode. Modern x-ray tubes use the vacuum and tungsten anode to improve efficiency in generating x-rays. The interaction between x-rays and tissue consists of scattering and absorption and can be characterized by attenuation. Tissue attenuation of x-ray intensity is proportional to tissue density and atomic composition. Typically, x-rays are displayed with higher image intensity for tissue with more attenuation (such as bone and calcified lesions) and lower intensity for tissue with less attenuation (such as soft tissue, air in the lung, and fracture in a bone).
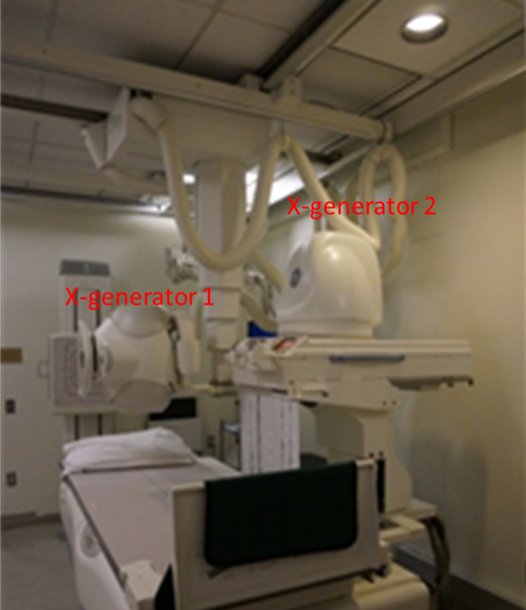
Use of x-ray imaging. Projection x-ray radiography is widely used in the clinic, particularly to visualize dense tissue, such as bone tissue or tumors, or contrasts in dense tissue, such as fractures in bone. For example, an x-ray machine may be used to examine a patient's scoliosis (abnormal curvature of the spine) or to check a patient for breast cancer (mammography). X-ray machines are also used to guide various interventional procedures, which is referred as fluoroscopy (Fig.4.2). An example is fluoroscopy guided coronary angioplasty in the cardiac catheterization suite: a cardiologist inserts a catheter into a femoral artery, moves it to the aorta, then a coronary ostium at the aortic root and then the targeted coronary artery in the heart to deploy a balloon to open the blockage in the artery.
There is some health risk associated with x-ray radiation, which may alter DNA and cause cancer. Low levels of ionizing radiation and infrequent x-ray exposure likely have minimal risk of developing cancer. The amount of x-ray exposure (radiation dose) is monitored by hospital staff working with x-ray equipment and on patients to ensure the risk is very low. However, projection radiography only provides 2D information and lacks depth resolution. This problem is addressed in the development of computed tomography.
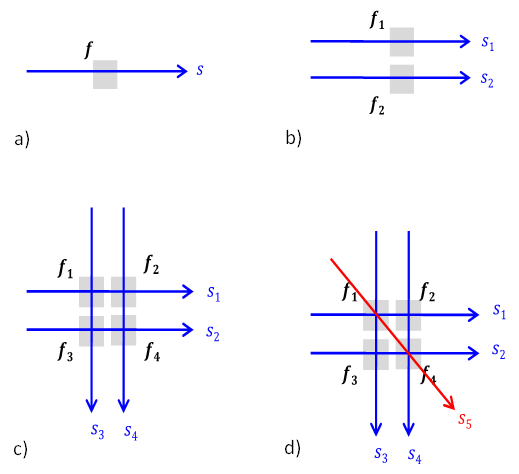
Invention of CT. To generate depth resolution or to create a cross sectional image requires 1) the physics insight that the attenuation detected along a ray is approximately a linear sum of attenuations of all body elements on the ray path and 2) the technical availability to compute the attenuation at each pixel (voxel to be precise, as a ray has thickness). The physics insight may be well known to physicists, and mathematical theories to reconstruct distribution from integral attenuation measurements have been developed in various direct and indirect ways. The basic idea of CT is illustrated in Fig.4.3: measurements from multiple angles are linearly related to attenuations at pixels in the cross section image, and solving this linear system equation allows CT reconstruction. Unfortunately, there was very little impact from people who attacked this problem before enough about computing was known and before computing power was available. Fortunately, after the Second World War, computing power had become available and it was time for the realization of CT. Allan M. Cormack and Godfrey N. Hounsfield, who both knew computing and physics, came across the problem of determining the cross section image of tissue attenuation coefficients at the right time, producing (particularly by Hounsfield) the generally usable CT.
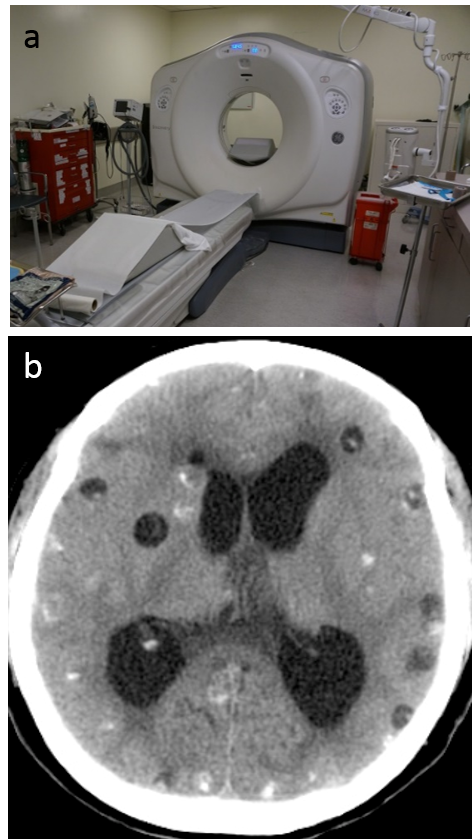
Use of CT. The cross sectional image generated from CT vastly improves the visualization details of internal structures that are buried in projection radiography. The projections at many angles are implemented by rotating the x-ray generator and detectors, and slipper ring technology has been critical for transmission of data and power. A modern CT system (Fig.4.4) typically uses multiple (n=64-256) rows of detectors to image a 3D volume rapidly. CT has a wide range of applications, including identifying intracerebral hemorrhage, lung cancer, and coronary angiography.
Nuclear imaging - PET and SPECT. PET and SPECT are similar to CT but the radiation in PET and SPECT comes from the radioisotope in radioligands or tracers injected into the body. The radioligands participate in biochemistries of the body, typically metabolic activities, revealing tissue functional information and abnormal functions caused by diseases such as tumor and inflammation. PET uses a positron-emitting tracer; the emitted positron annihilates with a nearby electron to produce a pair of gamma photons traveling in opposite directions for detection. There are many PET radioligands being developed by radiochemists to probe various tissue functions. A commonly used PET tracer is fluorodeoxyglucose (FDG), an analogue of glucose that detects metabolic uptake of glucose in tissue. SPECT uses a tracer that emits gamma rays. There are also many SPECT tracers. An example is technetium-99m-tetrofosmin or -sestamibi used in imaging blood flow in myocardium.
The radiation dose issue mentioned in x-ray projection radiography becomes more concerning in CT, which requires many projections. Obviously injecting radioisotopes into the body during PET and SPECT is a concern. This radiation issue (precisely, ionizing radiation) is avoided in two other imaging modalities: magnetic resonance imaging and ultrasound.
4.3 Magnetic resonance imaging (MRI)
Magnetic resonance physics. MRI is based on the interaction of a magnetic field with body tissue. More than 65% of the human body is composed of water, and each water molecule has two protons. Like a spinning top precesses in the gravity field of earth, a proton experiences a torque in a magnetic field and starts precession around the magnetic field at a frequency proportional to the magnetic field. This is called Larmor precession, with a frequency 128MHz (in radiofrequency range) in a 3T MRI scanner. Larmor precession generates a radiofrequency field that can be detected by a wire loop outside the body, while the proton loses energy. The resting state for the proton in the static 3T field (main magnetic field B0) is to align with the B0 field, experiencing zero torque. A radiofrequency field perpendicular to the B0 field can excite the proton and start precession. This is the magnetic resonance (MR) phenomenon (Fig.4.5a).
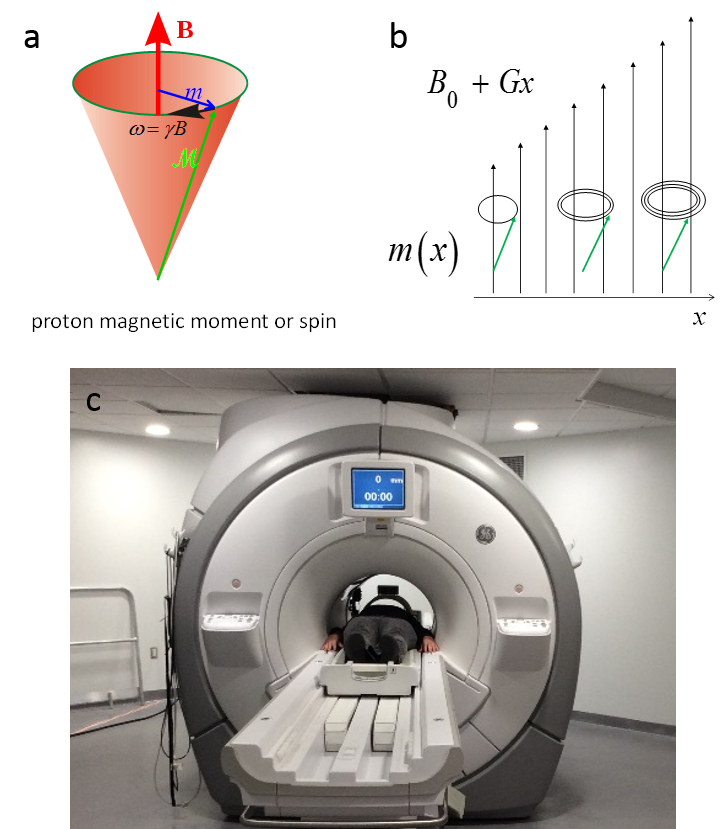
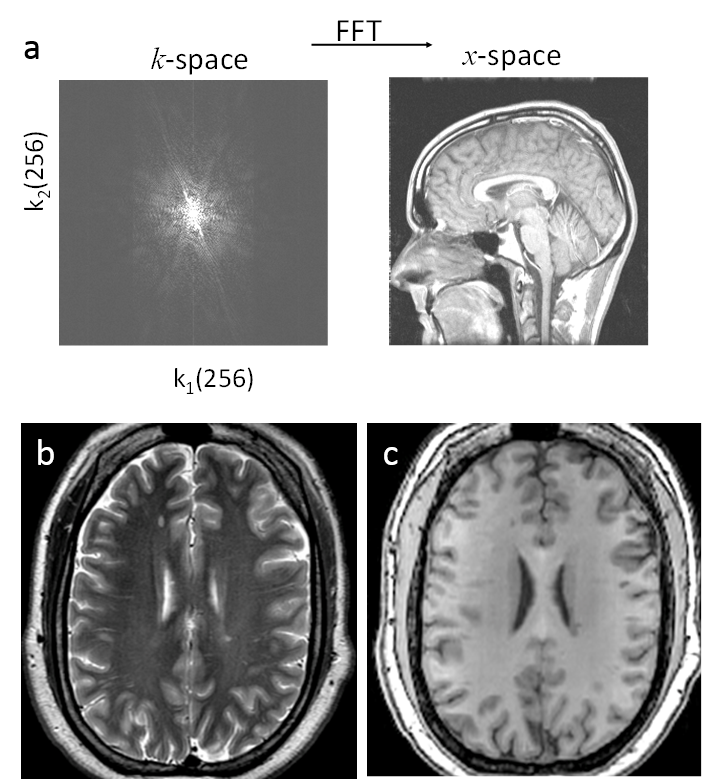
Invention of MRI. Magnetic resonance imaging (MRI) was invented right after the invention of CT and uses an approach similar to CT. The MR physics had become well known to physicists and chemists. The computer power had become available for image reconstruction. The time was ready for the birth of MRI, to which many people had contributed. Paul Lauterbur and Peter Mansfield are recognized for the current k-space sampling form of MRI. The linear system matrix connecting the cross section pixel elements and detected signal in CT can be similarly realized in MR by adding a spatial linearly varying magnetic field. This is the gradient field, the core for the invention of MRI, which makes the imaging system matrix a Fourier encoding matrix (Fig.4.5b). MRI can be reconstructed using inverse Fourier transform, which can be executed rapidly using the Fast Fourier Transform (FFT) algorithm (Fig.4.6a). In fact, CT reconstruction is also based on FFT in a modified form. Rapid image reconstruction using an FFT-like algorithm was very important in clinical practice in the early days of CT and MRI when computing power was limited.
Use of MRI. Because proton spin precession is very sensitive to the microenvironment of water, MRI is the method of choice for studying soft tissues, including tissues in the brain, heart, liver, knee, shoulder, etc. Major tissue information in MRI includes the following (Principles of magnetic resonance imaging: physics concept, pulse sequence and biomedical applications. Yi Wang, www.createspace.com):
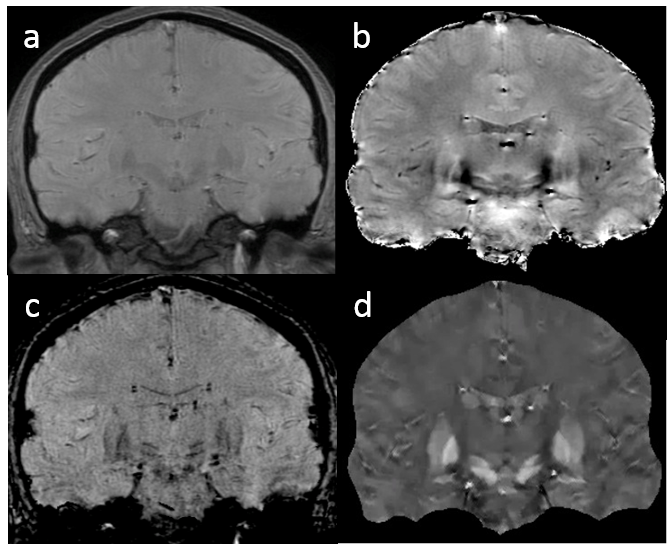
1) proton thermal microenvironment, which determines water spin T1/T2 relaxation, which largely reflects the cellular contents (macromolecules, membranes, etc.). Approximately, the relaxation rate increases or relaxation times decrease with concentration of cellular contents (macromolecules, membranes, etc.). For example, white matter with highly concentrated myelin (lipid bilayers) has shorter T1 and T2 (darker on T2 weighted (e-TE/T2) images and brighter on T1 weighted (1 - e-TR/T1) images), compared to gray matter in the brain (Figs.4.6b&c). Here TE is the so-called echo time, and TR the repetition time.
2) transport processes including blood flow, perfusion and diffusion, which affect water spin magnitude and phase.
3) molecular electron cloud's polarization by B0, generating susceptibility field outside the molecule and chemical shift inside the molecule.
Accordingly, there are the following commonly used MRI scans (so called sequences):
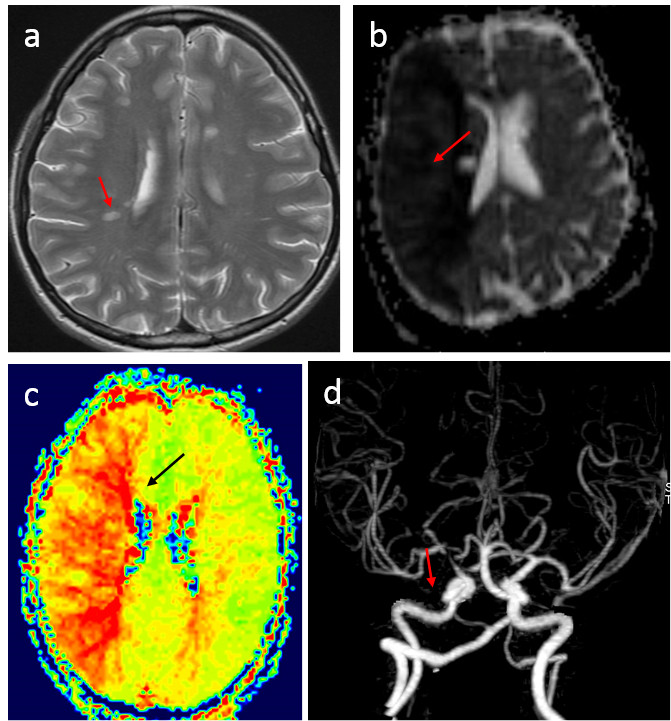
1) T1 and T2 weighted imaging, using the spin echo sequence, are included in almost all MRI protocols in clinical practice. (Spin echo uses 1800 RF pulse to compensate susceptibility effects and to reveal on relaxation effects, compared to gradient echo.) T2 weighted imaging is used to assess cellular contents in a voxel. For example, loss of myelin content appears as less T2 relaxation decay or hyperintensity on T2 weighted images (Fig.4.7a). T1 weighted imaging is typically used in conjunction with gadolinium injection and compared with pre-injection to the integrity of the blood brain barrier.
2) Diffusion weighted imaging sensitized by strong gradients is used to assess tissue damage in ischemic stroke and in tumor; for example, diffusion is reduced in acute ischemia (Fig.4.7b). Diffusion in the brain white matter depends on orientation. Acquisitions using gradients in various directions can be used to form diffusion tension imaging, which are used to study white matter fibers.
3) Perfusion (blood flow in capillaries) weighted imaging by labeling upstream flowing spins using RF pulses or a contrast agent is used to assess regional tissue blood flow, which is very important for evaluating ischemia and other diseases (Fig.4.7.c).
4) Magnetic resonance angiography images blood flow in large vessels, which is used to assess vascular diseases (Fig.4.7.d). MRI signal is sensitive to blood flow effects, including time-of-flow effect on signal magnitude, phase contrast effect, and blood contrast enhancement during contrast bolus passage. Contrast agents are sometimes used to enhance relaxation rates of water protons in blood.
5) T2* weighted imaging using the gradient echo sequence is used to detect magnetic susceptibility abnormalities in tissue caused by blood degradation products, iron deposition, calcification and contrast agents (Fig.4.8). The gradient echo signal magnitude has T2* weighting (e-TE/T2*): 1/T2*=R2* reflects the variance of magnetic field in a voxel multiplied by TE, so T2* weighted hypointensity increases with TE, voxel size and field strength. The gradient echo signal phase reflects the magnetic field multiplied by TE and the gyromagnetic constant: as field is a convolution of tissue magnetic susceptibility with the unit dipole field, deconvolution of the phase can reveal tissue magnetic property.
MRI does not use radiation and is generally considered safe. It is important to avoid bringing ferromagnetic objects close to the magnet, as the main magnetic field can put a very strong force on the ferromagnetic object. Accordingly, contraindications for MRI include various medical implants that may have ferromagnetic components. Currently, most medical implants have been made MRI compatible, which needs to be checked and confirmed on the safety handbook at the MRI scanning console.
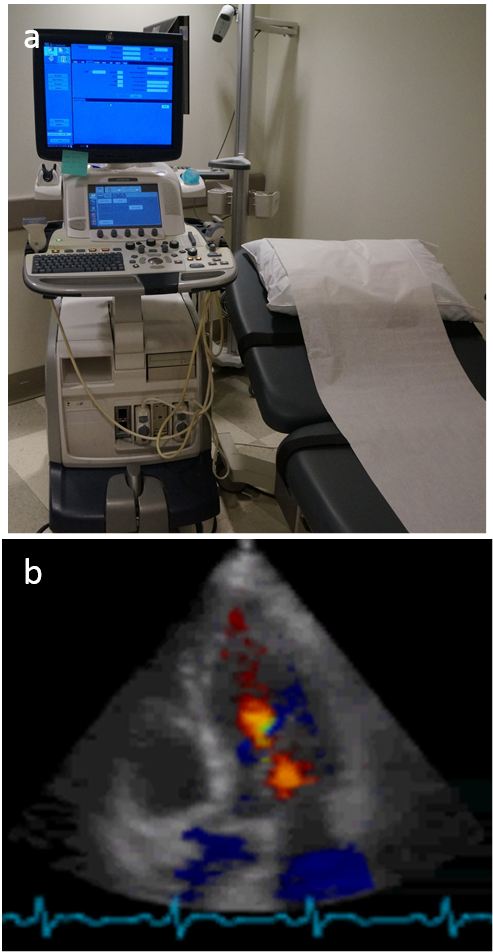
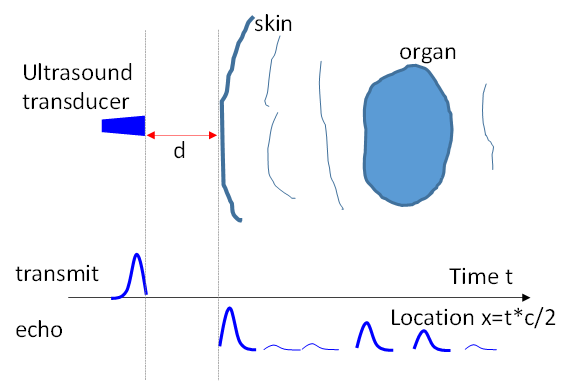
Basic idea of ultrasound. Sound wave penetration through the body is well known in human history. In fact, the stethoscope (invented in 1816 by Rene Laennec) is a common tool carried around physician's neck to aid the hearing of sound from the patient's heart, lung and other internal organs. Ultrasound is a sound wave with frequency above the human audible range (>20kHz). By the end of the 19th century, it was known that bats use ultrasound to locate/see things, and piezoelectric effects were used to make transducers for generating and detecting ultrasound. Paul Langevin attempted in 1917 to detect a submarine using ultrasound. The idea of ultrasound imaging or echolocation is based on the time of flight in sound wave propagation and reflection (Fig.4.9). Tissue boundaries generate strong sound wave reflection. Scanning using an array of transducers over a range of locations allows formation of an image (vertical positions in Fig.4.9 to form a 2D image, and adding an additional scanning direction for 3D image). A moving object also changes the frequency of the reflected sound wave, which is called the Doppler effect (as in the pitch difference between the approaching and passing siren of an emergency vehicle). Blood flow can be measured from the frequency difference between transmission and echo and is typically displayed in color (Fig.4.10b).
Use of ultrasound. Though the image quality of ultrasound is poorer compared to MRI, ultrasound generation and detection is cheaper, faster and more portable than that of MRI. Ultrasound is an important imaging method that does not use radiation, particularly for the dynamic imaging of moving objects. Common uses of ultrasound in hospitals include imaging fetuses in prenatal care, the heart pumping function (Fig.4.10b), bladder function, etc.